
통계 데이터 분석 -KNN회귀PYTHON/데이터분석2023. 9. 15. 17:16
Table of Contents
K-최근접이웃(K-nearest neighbor, KNN)
회귀 : 임의의 어떤 '숫자'를 예측하는 문제
즉 KNN회귀는 주변의 가장 가까운 K개의 샘플을 통해 값을 예측하는 방식이다.
from sklearn.datasets import load_iris  #iris 데이터셋 불러왔다

iris_data = load_iris() #불러온 데이터 셋 iris_data라는 변수에 저장
iris_data #출력

"""
데이터셋 로드
.
.
.

 'data_module': 'sklearn.datasets.data',
 'feature_names': ['sepal length (cm)',
  'sepal width (cm)',
  'petal length (cm)',
  'petal width (cm)'],
 'filename': 'iris.csv',
 'frame': None,
 'target': array([0, 0, 0, 0, 0, 0, 0, 0, 0, 0, 0, 0, 0, 0, 0, 0, 0, 0, 0, 0, 0, 0,
        0, 0, 0, 0, 0, 0, 0, 0, 0, 0, 0, 0, 0, 0, 0, 0, 0, 0, 0, 0, 0, 0,
        0, 0, 0, 0, 0, 0, 1, 1, 1, 1, 1, 1, 1, 1, 1, 1, 1, 1, 1, 1, 1, 1,
        1, 1, 1, 1, 1, 1, 1, 1, 1, 1, 1, 1, 1, 1, 1, 1, 1, 1, 1, 1, 1, 1,
        1, 1, 1, 1, 1, 1, 1, 1, 1, 1, 1, 1, 2, 2, 2, 2, 2, 2, 2, 2, 2, 2,
        2, 2, 2, 2, 2, 2, 2, 2, 2, 2, 2, 2, 2, 2, 2, 2, 2, 2, 2, 2, 2, 2,
        2, 2, 2, 2, 2, 2, 2, 2, 2, 2, 2, 2, 2, 2, 2, 2, 2, 2]),
 'target_names': array(['setosa', 'versicolor', 'virginica'], dtype='<U10')}

"""
data =iris_data['data']  #샘플데이터,data키로 접근해서 가져온다.
target = iris_data['target'] #라벨데이터
tnames = iris_data['target_names'] #라벨데이터의 이름

for i,y in enumerate(target):
  print(f'{i}:{tnames[y]}')
sepal_lengths=data[:50,[0]] #setosa 품종의 sepal_length만 추출(독립변수로 사용하기 위해 2차원 배열)
sepal_widths = data[:50,1] #setosa 품종의 sepal_width만 추출 (종속변수로 사용하기 위해 1차원 배열)
sepal_widths
"""
array([3.5, 3. , 3.2, 3.1, 3.6, 3.9, 3.4, 3.4, 2.9, 3.1, 3.7, 3.4, 3. ,
3. , 4. , 4.4, 3.9, 3.5, 3.8, 3.8, 3.4, 3.7, 3.6, 3.3, 3.4, 3. ,
3.4, 3.5, 3.4, 3.2, 3.1, 3.4, 4.1, 4.2, 3.1, 3.2, 3.5, 3.6, 3. ,
3.4, 3.5, 2.3, 3.2, 3.5, 3.8, 3. , 3.8, 3.2, 3.7, 3.3])
"""import matplotlib.pyplot as plt
plt.plot(sepal_lengths[:,0],sepal_widths, 'ro', label='setosa')
plt.xlabel('sepal-length')
plt.ylabel('sepal-width')
plt.yticks([0,max(sepal_widths)]) #눈금
plt.title('iris-setosa')
plt.show()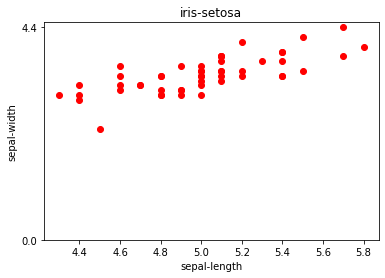
import numpy as npdef distance(x1, x2):
if isinstance(x1, int) and isinstance(x2, int): #두 개의 값이 모두 int 형식일 때
return np.abs(x2-x1) #차이의 절대값을 반환
if isinstance(x1,list) and isinstance(x2,list):
x1=np.array(x1)
x2=np.array(x2)
return sum((x1-x2)**2)**(1/2)na1 = np.array([1,2])
na2 = np.array([4,6])
distance(na1, na2)
#5.0
def find_k_nearest_neighbor(xs,ys,tx,k=5):
  """
  입력 매개변수:xs,ys,tx,k
    xs:독립 변수(학습 데이터)
    ys:종소 변수(학습 데이터)
    tx:독립변수(예측에 사용할 신입)
    k:찾을 이웃 수
  반환: k개의 이웃의 y의 평균값
  """
  sarr=[]
  for i,x in enumerate(xs):
    dis = distance(x,tx)
    sarr.append((dis,i)) #계산한 거리와 인덱스를 보관

  sarr.sort(key=lambda x:x[0])#dis 순으로 정렬

  k = min(k,len(sarr)) #현재 학습 데이터 개수와 k 중에 최솟값을 k로 확정
  neighbors =[x[1] for x in sarr[:k]] #거리가 가까운 이웃 k개의 인덱스로 리스트 구성
  return sum(ys[neighbors])/k #이웃의 평균 값을 반환
def find_k_nearest_neighbors(xs,ys, t_xs, k=5):
return [find_k_nearest_neighbor(xs,ys,tx,k) for tx in t_xs]pred_val = find_k_nearest_neighbors(train_xs, train_ys, test_xs)
pred_valplt.plot(pred_val,'ro', label='predict')
plt.plot(test_ys,'b.',label='actual')
plt.ylim(0,5)
plt.legend()
plt.xlabel("index")
plt.ylabel("sepal-width")
plt.title("iris-setosa")
plt.show()
KNN에서 독립변수에 특성이 여러 개이고 특성에 따라 크기의 차이가 상당할 때
train_xs2 = np.array([[180,0.84],[190,0.89],[120,0.89],[150,0.49],[160,0.58],[170,0.65]])#[키, 몸무게]
train_ys2 = np.array([32,33,24,26,30,31]) #[허리둘레]
print(find_k_nearest_neighbor(train_xs2,train_ys2,[201,1.10],k=1))
print(find_k_nearest_neighbor(train_xs2,train_ys2,[186,0.84],k=1))

"""
33.0
33.0
"""
distance([180,0.84],[186,0.84]),distance([190,0.89],[186,0.84])
"""
(6.0, 4.000312487793923)
"""plt.plot(train_xs2[:,0],train_xs2[:,1],'ro', label='sample')
plt.plot([186],[0.84],'b^',label = "test")
plt.legend()
plt.xlim(0,210)
plt.ylim(0,1.10)
plt.show()
'PYTHON > 데이터분석' 카테고리의 다른 글
| 2-1 훈련세트와 테스트 세트 (0) | 2023.09.15 |
|---|---|
| 1-3 마켓과 머신러닝 (0) | 2023.09.15 |
| 통계 데이터 분석 -확률 (0) | 2023.09.15 |
| 통계 데이터 분석 -선형회귀 (0) | 2023.09.15 |
| 데이터 분석에 자주 사용하는 문법 (0) | 2023.09.15 |


